Sometimes it seems like most information that adults encounter these days is condensed into a visual format. We just don’t have the attention span to read a whole article, and instead, look for a quick infographic showing the bullet points.
On the other hand, charts and graphs and diagrams have been around for a long time, so maybe people have always wanted the quick version?
Either way, it’s crucial that students know how to interpret information presented to them in visual formats and see how these visuals enhance the text.
In today’s post, I’ll share the process that I use to get students thinking about the different ways information can be presented visually and how these visuals can deepen our understanding of a text.
Depending on what else we are doing and at what point in the year we start, this could be spread out over several days, a whole week, or even longer.
This works with any informational text, but it’s an especially great way to get students familiar with the Science or History texts they will be using all year long!
Getting Started:
To get students ready to discuss and analyze visual text features, I want to get their brains thinking! The best way I’ve found to do this is to ask them to name some of the different ways that they have seen information presented visually. These could be from a magazine, a website in a book, or even something from a TV show. Create a class chart and keep track of all of their ideas.
Find and Analyze:
After students have created a good-sized list, it’s time for them to find examples! You can ask students to self-select a nonfiction book or have them look in a specific textbook if they want to go that route.
Whichever type of text you choose, have students look for specific examples of visuals that provide information. Graphs, timelines, diagrams, charts…it’s all fair game. You might want to hand out a few sticky notes so they can mark the pages (kids LOVE a good reason to use sticky notes)!
After students have had a chance to find some real-life examples, look at exploring and discussing them as a class. It might be helpful to have a few selected ahead of time to highlight the specific points that you want to discuss.
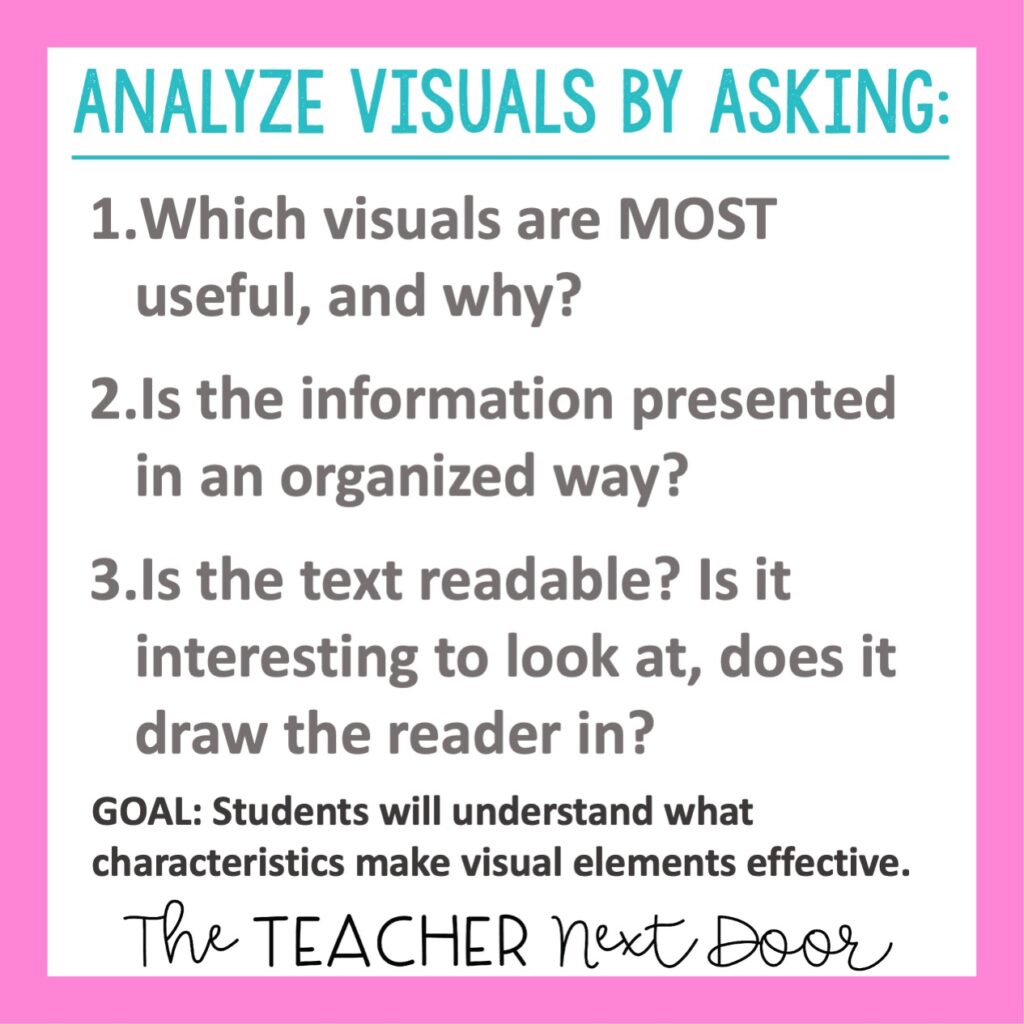
Have students analyze the visuals:
- Which visuals are MOST useful, and why?
- Is the information presented in an organized way?
- Is the text readable? Is it interesting to look at, does it draw the reader in?
This will help students start to identify what makes a visual element effective.
Compare and Contrast:
Another fun thing to do here is to compare two different texts, one that has quite a few charts, graphs, timelines, or other visual aids and one that doesn’t have any. This would be a great way to spark a discussion about what exactly these features add to a text. Which text communicates information more clearly? Which text is more interesting to read?
DIY:
If you have time, a great idea to go along with this strategy would be to have students create their own visual representation of information. This could be a timeline, infographic, chart…anything that visually shows information.
You could ask all the students to create the same type of visual (a timeline of their life, for example), or give them a few options and let them choose. They can get really creative!
Are you in need of some informational text practice that won’t take ages to prep? I can help you with that! This Informational Text Using Charts Digital Reading Google Slides 4th Grade Nonfiction resource includes high-interest reading passages and colorful graphics (timelines, diagrams, charts, graphs). Students are asked to answer a variety of questions using the text and the visuals. This paperless resource can be used in PowerPoint or Google Slides and doesn’t require any teacher prep!
Looking to read more? Check out these posts!
How to Inspire Students to Ask and Answer Meaningful Questions About Informational Text
Character Traits & Story Events: How to Help Students Discover a Meaningful Connection
Teaching Nonfiction Text Features
![]()
Standards Alignment RI.4.7 – Interpret information presented visually, orally, or quantitatively (e.g., in charts, graphs, diagrams, timelines, animations, or interactive elements on Web pages) and explain how the information contributes to an understanding of the text in which it appears.